Trends in the Use of Election Day Voter Registration
Twenty-one states and the District of Columbia have adopted election day voter registration (EDR), allowing qualified unregistered individuals to register to vote and cast a ballot at the polls on election day or during early voting (1). Two other states (Alaska and Rhode Island) allow EDR, but only to vote for President and Vice President (2). This report looks broadly at how EDR use has varied across election years and between states over the past two decades. Has EDR use been more common in certain states or in certain elections, and if so, what appears to drive the differences? Using data on elections since 2004 to estimate the share of the electorate using EDR, we observe several trends:
- Varying Use: EDR use differs significantly by state and by election, constituting as much as 20% of the electorate in certain elections and less than 1% of the electorate in others.
- Midterm v. Presidential Elections: EDR voters make up a much larger share of the electorate in presidential elections than midterm elections.
- No Initial Surge: The share of voters using EDR does not surge in the first election after adoption, and then diminish in subsequent elections. EDR usage is generally steady between initial and subsequent elections, aside from variation between presidential and midterm elections.
- NVRA-Exempt States: The proportion of EDR voters is generally much higher in states that are exempt from the National Voter Registration Act (NVRA). NVRA-exempt states are not required to register voters through motor vehicle transactions and can remove voters from the rolls with less process, which may explain the greater need for EDR.
- Other Registration Reforms: The share of voters using EDR appears to decline when states adopt reforms making pre-election day registration easier. For example, when states adopt online voter registration, EDR voters form a lower share of the electorate. EDR usage also appears to be lower in states with automatic voter registration.
Data Collection
Using data from the U.S. Election Assistance Commission and the U.S. Elections Project, we can analyze trends in EDR over the past two decades and generally observe how the use of EDR differs across elections and states.
The U.S. Election Assistance Commission (EAC) provides data on the use of EDR for the past nine federal elections, reporting the total number of individuals using the EDR process in each state (3). We pair these totals with turnout data from the U.S. Elections Project (4). By dividing the total number of individuals using EDR by the total number of voters, we can estimate the share of the electorate using EDR. This analysis does not include states that allow registration at the polls during some or all of the early voting period, but not on election day. The full data set is available here.
We primarily focus on states that have had EDR in place for five or more election cycles in order to analyze a representative sample of elections in each state. This narrows the analysis to eight states: Iowa, Idaho, Maine, Minnesota, Montana, New Hampshire, Wisconsin, and Wyoming. Idaho, Maine, Minnesota, and New Hampshire, Wisconsin, and Wyoming (5) have all had EDR since before 2004, the first election with available EAC data. Montana adopted EDR in 2005 (and repealed it in 2021, only allowing registration during early voting and not on election day). Iowa adopted EDR in 2007 (6).
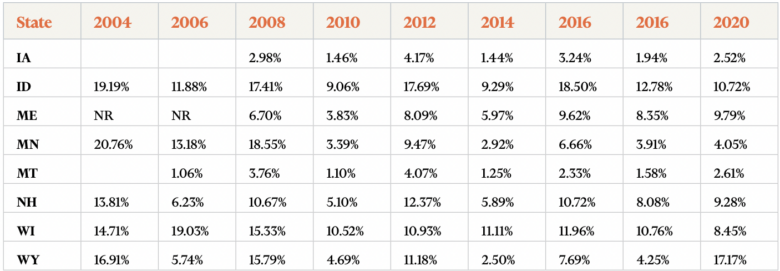
The following table shows the share of the electorate using EDR in each of these eight states in elections dating back to 2004. A blank space indicates the state did not have EDR in place for the election, while NR indicates the state did not report EDR totals to the EAC.
The following table shows the share of the electorate using EDR in each of these eight states in elections dating back to 2004. A blank space indicates the state did not have EDR in place for the election, while NR indicates the state did not report EDR totals to the EAC.
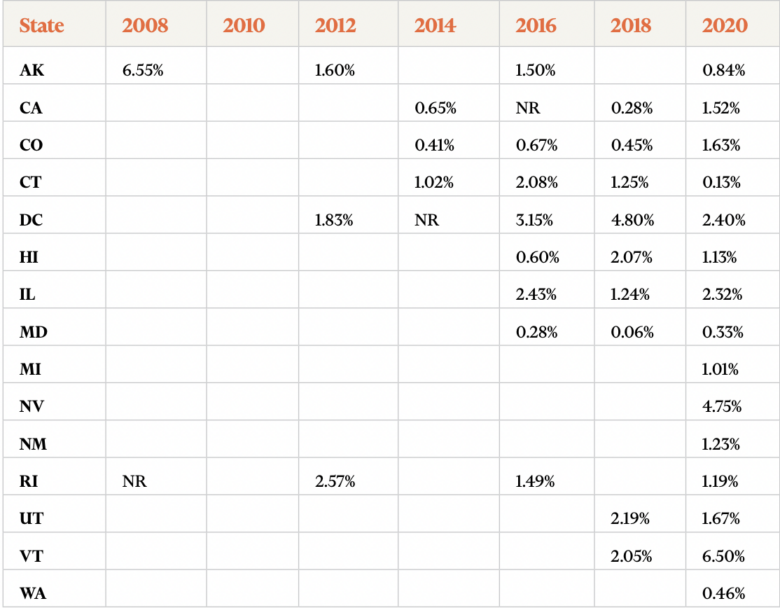
The table below shows the same data for states where EDR was adopted more recently, or has only been in place for presidential elections. As noted above, a blank space indicates the state did not have EDR in place for the election, while NR indicates the state did not report EDR totals to the EAC (7).
Observations
Using this data, we observe several trends in EDR usage across states and elections over the past two decades.
First, the share of voters using EDR varies widely by state and by election. At its greatest use, EDR has constituted roughly 20% of the electorate in certain elections. In the 2004 election, EDR voters made up 20.76% of the electorate in Minnesota, and 19.19% of the electorate in Idaho. More recently, EDR voters made up 17.17% of voters in Wyoming in the 2020 election. However, in other elections, EDR voters form only a small share of the electorate, constituting less than 1% of the electorate in recent elections in California, Colorado, Connecticut, Maryland, Hawaii, and Washington.
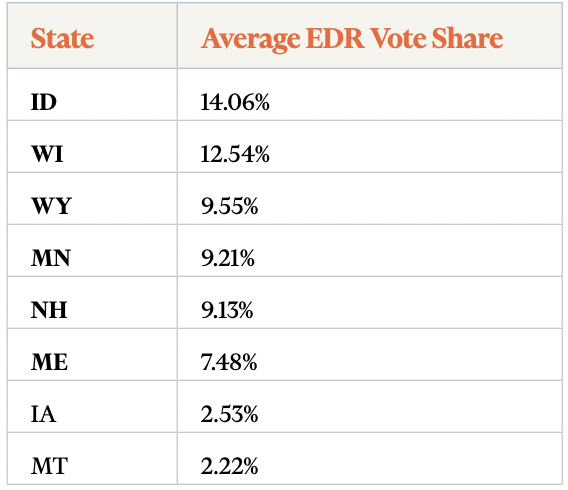
Idaho has the highest average EDR vote share, with an average of 14.06% of voters using EDR in each election. Of the eight states that have had EDR since 2008, Montana has the lowest average EDR vote share, with an average of 2.22% of voters using EDR in each election. Of all EDR states, Maryland has the lowest average EDR vote share, with 0.33% of voters using EDR. However, this only reflects one election with EDR in place.
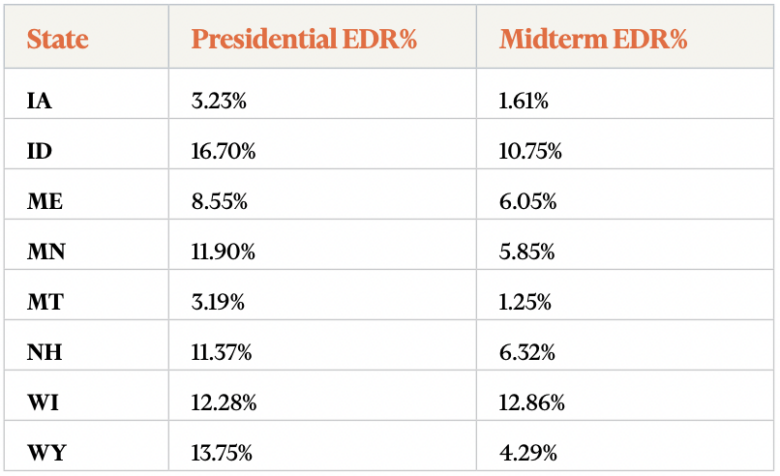
Second, EDR use is higher in presidential elections than midterms. The following table compares the average EDR vote share in presidential and midterm elections for the eight states that have had EDR since 2008.
The average EDR vote share is higher in presidential elections in all states except Wisconsin, where the midterm and presidential election share are roughly equal. In several states, including Iowa, Minnesota, Montana, and Wyoming, the average EDR vote share in presidential elections is more than double the average EDR vote share in midterm elections.
Previous research has noted that the turnout effects of EDR are larger in presidential elections than midterm elections for specific groups of voters (8). The observed difference in vote share between election types provides further support for this conclusion. EDR plays a greater role in presidential elections, presumably because presidential elections draw in additional lower propensity voters relative to midterm elections. These additional lower propensity voters may be less likely to be registered and more likely to rely on EDR.
Third, the data also indicates that EDR use does not surge in the first election in which the policy is in place. Election administrators and legislators in states considering EDR might worry that EDR will create significant burdens for the first election with the policy, presumably because a significant pool of unregistered voters will appear at the polls to use EDR, overwhelming poll workers unfamiliar with the policy. However, the data does not support this concern.
After Iowa adopted EDR for the 2008 election, the EDR vote share was 2.98%, roughly in line with the average EDR vote share for presidential elections since. Similarly, after Montana adopted EDR for the 2006 election, the EDR vote share was 1.06%, again roughly consistent with the average EDR vote share for midterm elections since then. In states that have adopted EDR since 2008, the same result is generally true, with EDR generally constituting less than 2% of the vote share (and never constituting more than 5% of the vote share) in the first election where it is in place. Concerns of a tidal wave of EDR voters in the first covered election appear misplaced.
State Presidential EDR% Midterm EDR% IA 3.23% 1.61% ID 16.70% 10.75% ME 8.55% 6.05% MN 11.90% 5.85% MT 3.19% 1.25% NH 11.37% 6.32% WI 12.28% 12.86% WY 13.75% 4.29%
Fourth, states that are exempt from the National Voter Registration Act (NVRA) use EDR at higher rates. Five states (Idaho, Minnesota, New Hampshire, Wisconsin, and Wyoming) are exempt from the NVRA because they had EDR policies in place for federal elections at the time the law went into effect in 1994 (9). Because these states are exempt from the NVRA, they are not required to offer voter registration at motor vehicle offices or social service agencies. Similarly, these states are not required to abide by the NVRA’s waiting period provisions before removing a voter from the rolls, and can cancel a voter’s registration immediately (10).
Predictably, in states where there are fewer options for pre-election day registration and voters can be purged more easily, EDR plays a greater role. Voters who might otherwise have registered at the DMV or who were erroneously purged must utilize EDR in order to vote. The following table shows the average EDR vote share in the eight states that have had the policy in place since 2008. The NVRA-exempt states (in bold) dominate the list, taking the top five spots.
Fifth, other registration reforms appear to reduce the load on EDR. Just as a lack of registration at DMVs and social service agencies can increase the share of voters using EDR, registration reforms that make pre-election day registration easier can lower the share of voters who need to register at the polls.
Consider again the table showing EDR vote shares over time, with the years in which each state had online voter registration in place bolded (11).
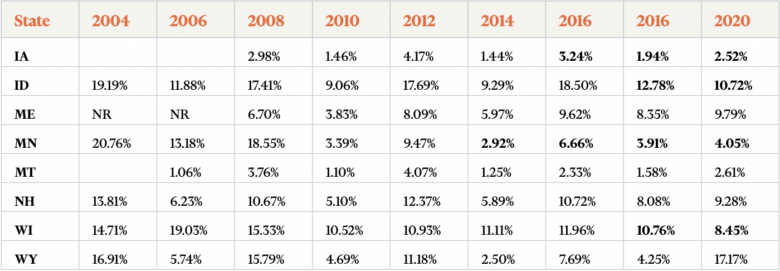
In the states that have adopted online registration, the availability of an additional pre-election day registration option appears to have reduced the share of EDR voters. The most obvious drop has occurred in Minnesota, where EDR use has sharply declined since 2014. In addition, slight drops also appear to have occurred in Iowa, Idaho and Wisconsin following adoption of online registration. This makes sense; when individuals can easily register to vote online before election day, fewer people will need to register to vote at the polls.
Other policies may also reduce the load on EDR. The EDR vote share in states that have adopted the policy more recently is fairly low. No post-2012 jurisdiction has an average EDR vote share above 5%, and most have an average EDR vote share under 3%. Notably, all of these states have adopted OVR, and all of them have also implemented automatic voter registration or a similarly streamlined system, where eligible individuals at the DMV must affirmatively decline a registration option to avoid voter registration (12). Although there are fewer elections to analyze, this streamlining of DMV registration may similarly reduce the load on EDR, by registering more individuals well in advance of election day.
References
(1) 1 National Conference of State Legislatures, Same Day Voter Registration, https://www.ncsl.org/research/elections-and-campaigns/sameday-registration.aspx (hereinafter “NCSL SDR”). The total of 21 states includes Virginia, where EDR was enacted in 2020 and takes effect in October of 2022, and Delaware, where EDR was enacted in July 2022, and will be in place for elections this year. A handful of other states do not have EDR, but have some form of same day voter registration (SDR), where individuals can register to vote at the polls during all or part of the early voting period. This report focuses on states with EDR, as opposed to the broader category of states with SDR.
(2) Id.
(3) U.S. Election Assistance Commission, Election Administration and Voting Survey (EAVS), https://www.eac.gov/research-and-data/datasets-codebooks-and-surveys.
(4) U.S. Elections Project, Voter Turnout Data, http://www.electproject.org/.
(5) See NCSL SDR.
(6) Id.
(7) Alaska and Rhode Island did not report EDR totals for 2004 to the EAC. Therefore, 2004 is not included in this table.
(8) 8 See, e.g., Jacob M. Grumbach & Charlotte Hill, Rock the Registration: Same Day Registration Increases Turnout of Young Voters, 84. J. Pol. 405 (2022).
(9) See U.S. Dep’t of Justice, The National Voter Registration Act of 1993 (NVRA), https://www.justice.gov/crt/national-voter-registration-act-1993-nvra.
(10) Id.
(11) National Conference of State Legislatures, Online Voter Registration, https://www.ncsl.org/research/elections-and-campaigns/ electronic-or-online-voter-registration.aspx.
(12) National Conference of State Legislatures, Automatic Voter Registration, https://www.ncsl.org/research/elections-and-campaigns/ automatic-voter-registration.aspx; Taylor Anderson, Do you want to register to vote? Utah enacts widespread election law changes, including Election-Day registration. Here are all the changes, Salt Lake Tribune, Mar. 8, 2018, https://www.sltrib.com/news/ politics/2018/03/08/do-you-want-to-register-to-vote-utah-enacts-widespread-election-law-changes-including-election-dayregistration-here-are-all-the-changes/.